This is the project made during my 2 months as an intern at ARUP.
Its goal is to automate the process of picking data for the Hong Kong Annual Traffic Census (ATC).
The program is distributed to employees as an .exe file, created with Pyinstaller.
The user interface has two tabs, a path selection tab, and a tool tab, and is created with PyQt6, a Python wrapper for the Qt C++ libraries.
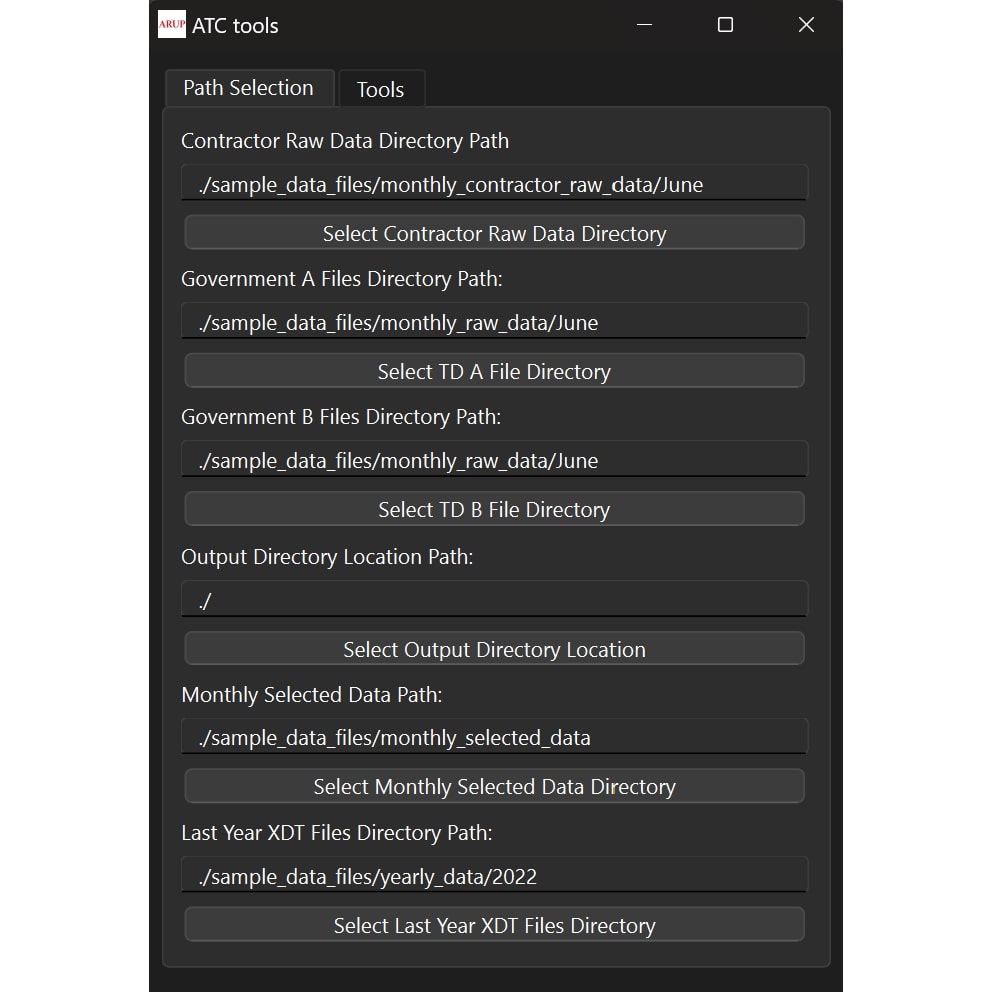
The path selection tab allows users to enter or select file or directory paths for processing.
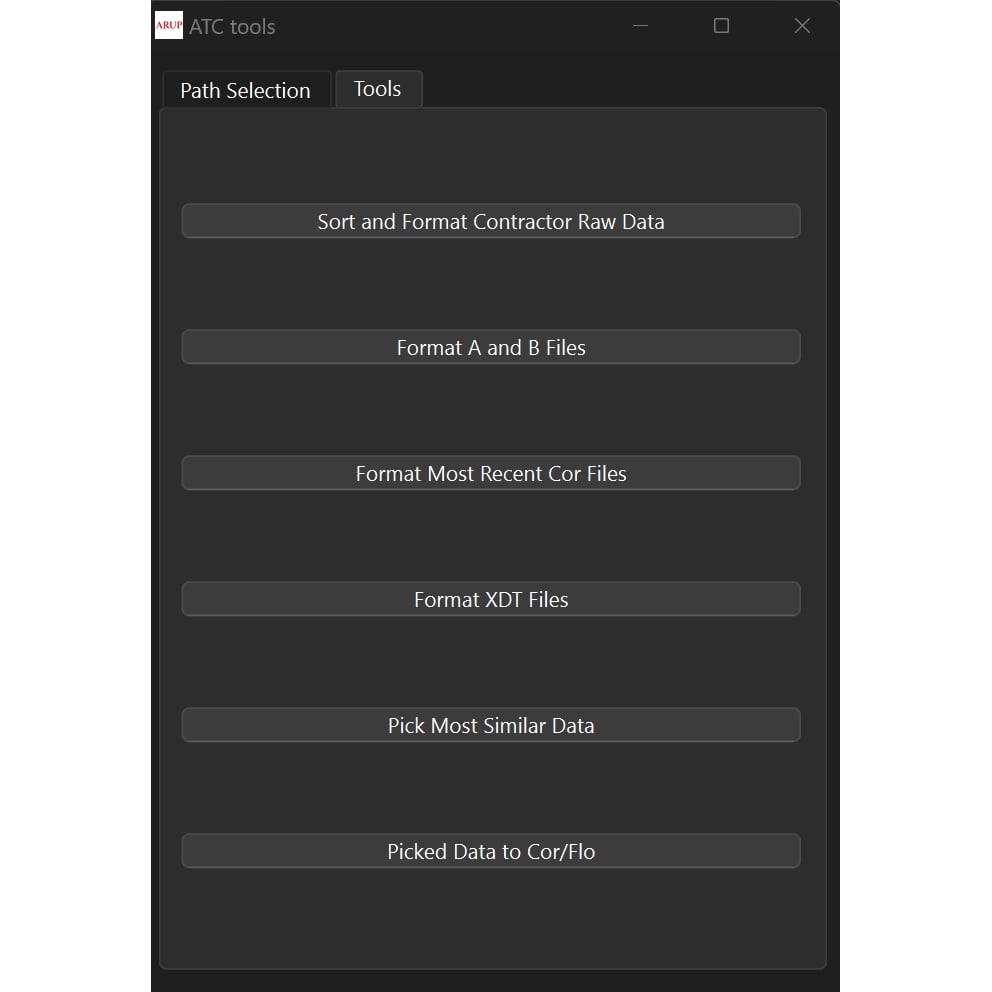
The tool tab consists of buttons that activate tools, processing the files or directory specified in the first tab.
Path selection tab
- The path selection tabs have six labeled input fields, each with a button to open the Windows file dialog.
- The selected file or directory's path is then pasted into the corresponding input field.
- Tools might require specific input fields to be filled, if not, the program will raise an error.
- The file or directory might need to be in a specific format, if not, the program will raise an error.
Intro to the tool tab
- The tools use Pandas to output .xlsx Excel files, allowing for manual adjustments before further processing by parsing the Excel files.
- B files are formatted from A files, which are formatted from CDL files created by car counting machines; all of them can be treated as text files with different formats.
- A/B files are generated directly from the car counting machine, but if an error occurred, only the CDL files are returned.
- Threading is used, so even if a tool is running, the user can see the status of the process from the tool tab.
- If a GUI is required but is closed, the tool will terminate and an error prompt will be shown to the user, specifying why it is required.
-
The tool tab consists of 6 tools:
- Sort and format contractor raw data
- Format A and B files
- Format most recent cor files
- Format XDT files
- Pick most similar data
- Picked data to COR/FLO
Sort and format contractor raw data tool
- The contractor raw data consists of .CDL files, image files, A and B files.
- Once you press the button for the tool:
- A GUI asks if the user wants to copy the A/B files to the grouped A/B files directory.
- Another GUI asks if the user wants to format CDL files into A or B files, as they must be converted for final data submission to the government.
- The CDL files are then formatted to an Excel file, but as CDL files don't contain the bound of what the cars are heading to...
- Another GUI asks for the bound data and the formula to code the data from the CDL files.
- If A/B files are set to be recreated, for each CDL file, a GUI will ask the user for the counting accuracy.
- Recreated A/B files are saved to a directory named "from_cld_a_b_files" in the output directory.
- The formatted CDL file's Excel file is saved to a directory named "excel_files" in the output directory.
Sort and format contractor raw data tool
- The contractor raw data consists of .CDL files, image files, A and B files.
- The main purpose of this tool is to group up the A and B files and format the .CDL files to an Excel file.
- The formatted .CDL files can then be viewed and edited, which then can be used for data comparison and picking.
- Once you press the button for the tool:
- If the "grouped_a_b_files" directory exists, a GUI prompts the user to keep any existing A/B files.
- A GUI asks if the user wants to copy the A/B files to the grouped A/B files directory.
- Another GUI asks if the user wants to format .CDL files into A or B files, as they must be converted for final data submission to the government.
- The CDL files are then formatted to an Excel file, but as CDL files don't contain the bound of what the cars are heading to...
- Another GUI asks for the bound data and the formula to code the data from the CDL files.
- If A/B files are set to be recreated, for each CDL file, a GUI will ask the user for the counting accuracy.
- Recreated A/B files are saved to a directory named "from_cld_a_b_files" in the output directory.
- The formatted CDL file's Excel file is saved to a directory named "excel_files" in the output directory.
Format A and B files tool
- A and B files, though formatted, still aren't human-friendly to view and edit.
- This tool formats grouped A/B files for easy viewing, editing, and future data comparison or picking.
- Once you press the button for the tool:
- If the "grouped_a_b_files" directory exists, a GUI prompts the user to keep any existing A/B files.
- Another GUI will then ask if the user wants to add A/B files from the government directories into the "grouped_a_b_files" directory. The paths of the government A/B directories are read from the first tab.
- The A/B files in the "grouped_a_b_files" directory will then be formatted.
- The formatted A/B Excel file is saved to a directory named "excel_files" in the output directory.
Format most recent cor files tool
- Cor files are text files in a specific format, which are a month's picked data.
- The tool formats COR files for easy viewing, editing, and future data comparison.
- Once you press the button for the tool:
- If the "latest_cor_files" directory is not empty, a GUI asks the user if they want to keep the COR files in it.
- If COR files are not selected to be kept, or if no COR files exist in the "latest_cor_files" directory...
- The program will search through the monthly selected data directory, the path is specified in the path selection tab
- Each selected data directory for a month must include the year and month in its name.
- For each station, the most recent selected data, which is a COR file, is copied to the "latest_cor_files" directory.
- The program will then format the COR files in the 'latest_cor_files' directory into an Excel file, with each COR file represented as a separate sheet.
- The Excel file is then saved as "formatted_cor_files.xlsx" in the output directory.
Format XDT files tool
- XDT files are text files that contain a year's selected data for a specific station.
- This tool turns XDT files into an Excel file, with each station represented by a sheet.
- Once you press the button for the tool:
- The program gets the path of the XDT files directory from the path selection tab.
- Parsing each XDT file, it is formatted into sheets within the Excel file named "formatted_yearly_xdt_files.xlsx".
- The Excel file is then saved in the output directory.
Pick most similar data tool
- This tool is used to compare the most recent COR files with the formatted A/B files and CDL files.
- Selects the closest matching date for each weekday from the comparison as the picked data.
- Once you press the button for the tool:
- A GUI requests the desired month for comparison, as the formatted data may span multiple months.
- A GUI asks if the user wants to paste the station's yearly data into the comparison results sheet for manual review.
- For each station:
- An Excel sheet is created.
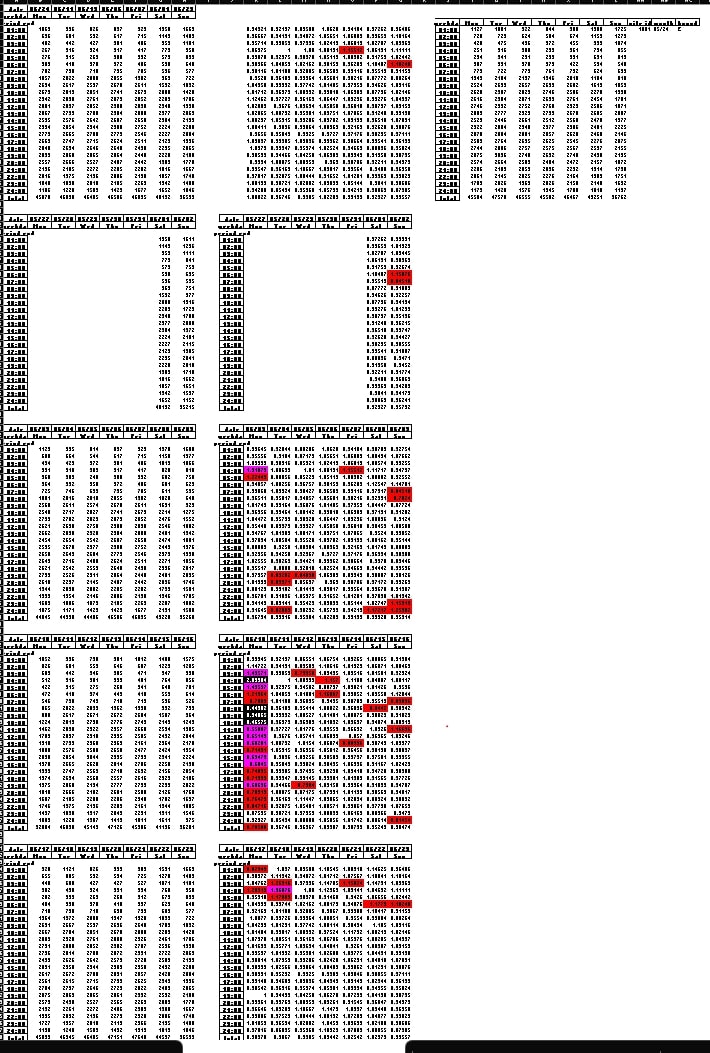
- The monthly data within the desired month is separated into blocks of weeks and pasted into the sheet.
- The comparison is performed, and the percentage results for each data value are placed next to each weekly block.
- Excel conditional formatting is applied to the compared data, with rules of:
- White if percentage results are invalid
- Black if percentage results not between 0.5 and 1.5
- Magenta if percentage results not between 0.7 and 1.3
- Red if percentage results not between 0.85 and 1.15
- Weights are then assigned to the dates, which then the desired dates are selected.
- The selected dates are then pasted to the top of the sheet, with the percentage results of the selected dates next to it.
- The sheet structure can be seen in image 3 in the image sidebar on large screen devices.
- If corresponding yearly data is selected to be pasted onto the sheet, it is then pasted onto the sheet.
- The Excel file is then saved in the output directory, as "compared_formatted_a_b_files.xlsx" or "compared_formatted_cdl_files.xlsx".
Picked data to COR/FLO tool
- FLO files are COR files in a different more human-readable format, required by the government.
- This tool is used to format the picked data into COR/ FLO files for submission to the government.
- Once you press the button for the tool:
- Check for either "compared_formatted_a_b_files.xlsx" or "compared_formatted_cdl_files.xlsx" in the output directory.
- Parse each sheet of the Excel files.
- Write the data parsed to a text file in the COR/ FLO file format.
- Save the text files in directories named "flo_file_output" or "cor_file_output", with the correct file names.